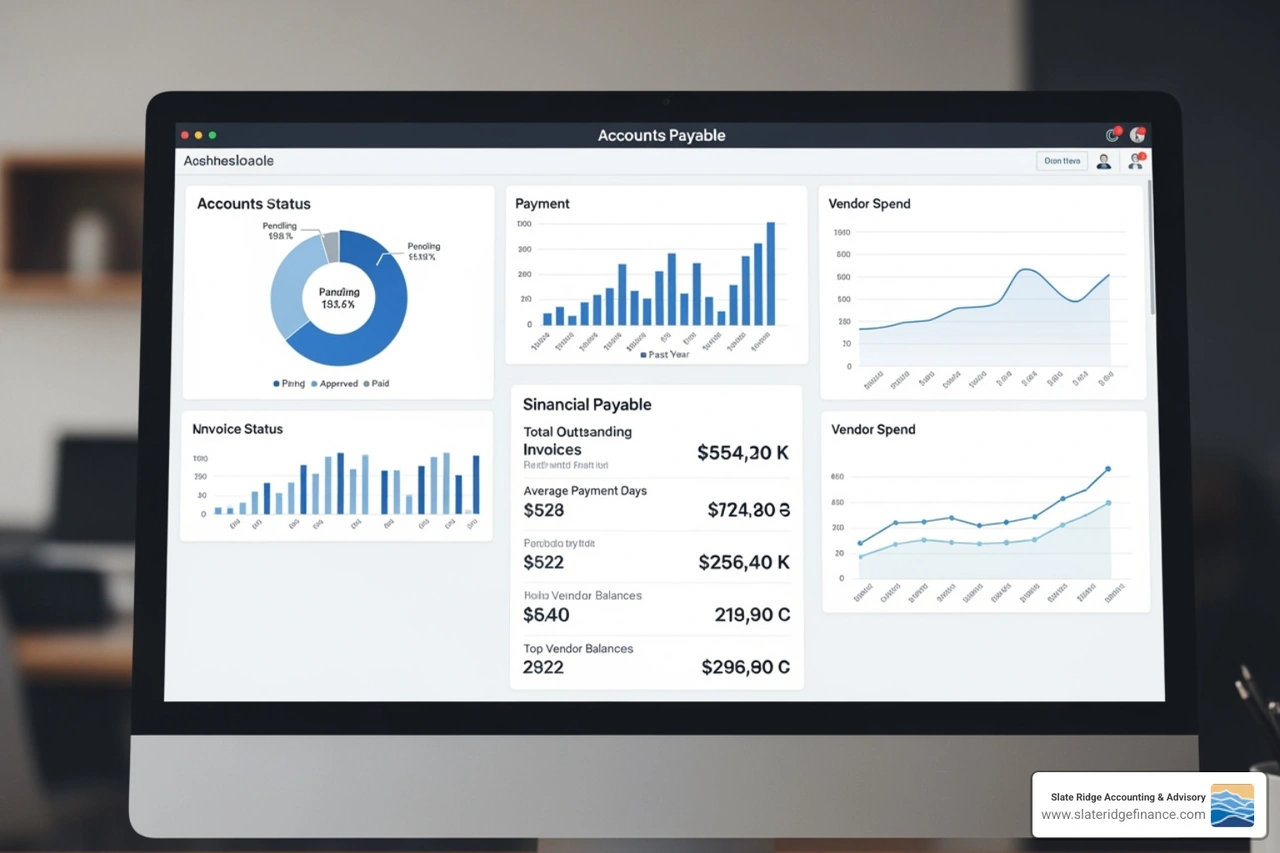

Build a Weekly KPI Dashboard for Your Hickory Small Business
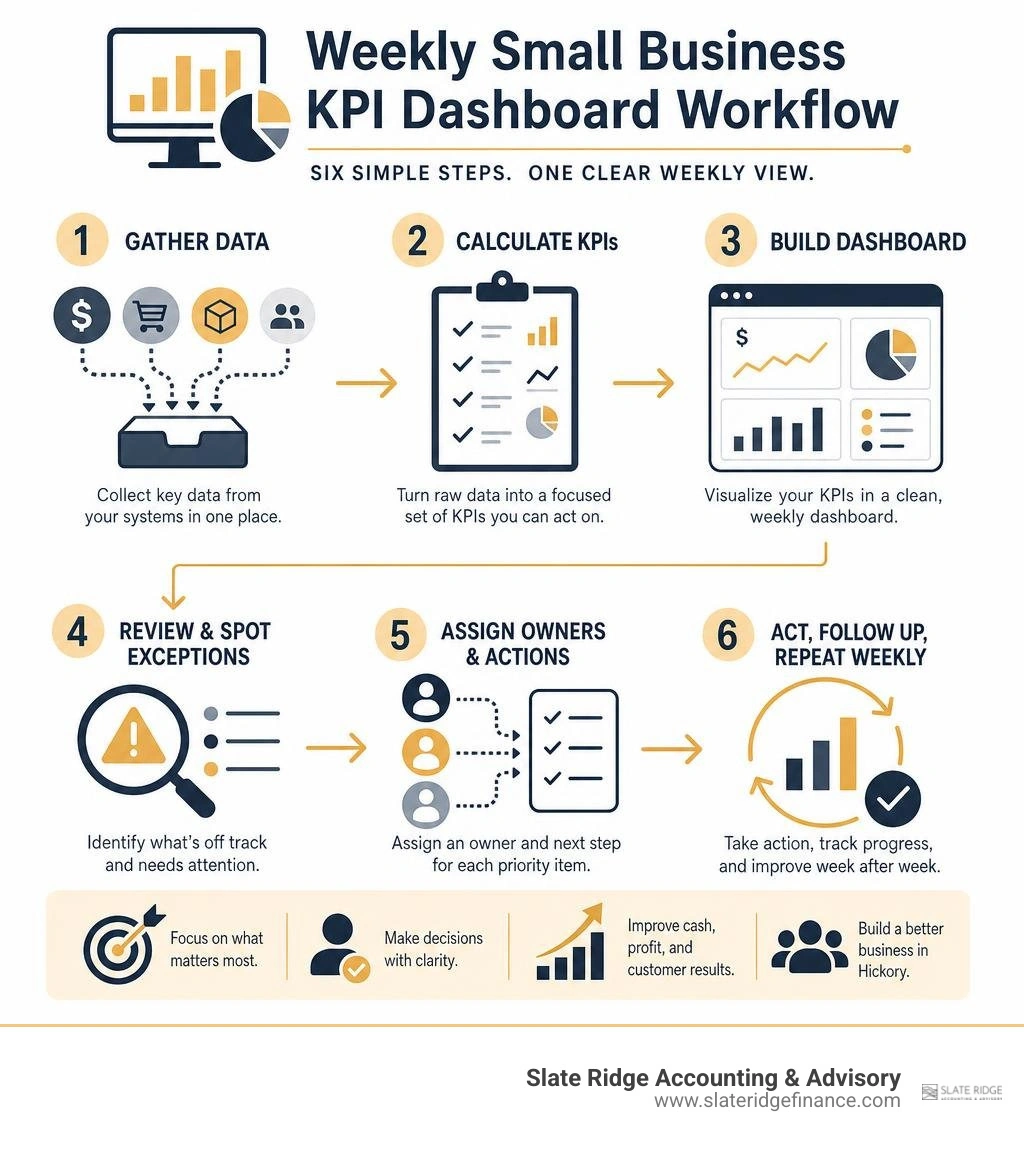
A KPI dashboard for a small business in Hickory should turn your accounting, sales, operations, and customer data into a short weekly view of what needs attention. Start with a small set of numbers you can act on:
- Cash available and upcoming cash needs
- Revenue, gross profit margin, and sales pipeline
- Accounts receivable aging and overdue invoices
- Labor, production, inventory, or job-cycle metrics
- One or two early-warning indicators, such as quote response time, missed calls, late shipments, or rising freight costs
The goal is not to track every number. It is to spot exceptions early, assign an owner, and make a decision before a small issue becomes an expensive monthly surprise.
For many Catawba County owners, the real problem is not a lack of data. It is data trapped in QuickBooks, spreadsheets, point-of-sale tools, production systems, and inboxes. A weekly dashboard creates one trusted view, helping you see where cash is slowing, work is piling up, or the owner has become the approval bottleneck.
We are Caroline and Joe, and we help business owners turn messy financial information into clearer weekly decisions.
Handy kpi dashboard small business hickory terms:
Why You Need a Custom KPI Dashboard Small Business Hickory Model
Running an enterprise across the Catawba Valley means managing moving parts across multiple departments. When you spend all your time fighting daily fires, strategic planning gets pushed aside. Small business owners often become the operational bottleneck because every major decision—from raw material purchases to extending customer credit—relies entirely on gut instinct rather than structured reports.
A custom reporting setup changes that dynamic by transforming scattered operational information into structured executive visibility. Instead of waiting weeks after month-end closing to review financial statements, a weekly dashboard provides the operational clarity required to make fast, calculated adjustments.
When your internal data pipeline is tied directly to stable infrastructure—supported by proactive technical solutions like Enterprise IT Monitoring, Hickory, NC | Hickory Computer—your reporting architecture functions smoothly without system dropouts or missing transaction logs.
Critical Financial and Operational Metrics to Track
The foundation of any high-performing dashboard lies in balancing lagging outcomes with actionable leading indicators. Lagging metrics tell you what has already happened, while leading indicators reveal where your operations are headed.
To get the most value from your financial performance analysis, track these core figures weekly:
| Metric Name | Type | Data Source | Target Benchmark | Why It Matters for Hickory Businesses |
|---|---|---|---|---|
| Cash Runway | Lagging | Bank Feeds & GL | 60–90 Days Operating Cash | Protects against seasonal revenue dips and supply chain delays. |
| Accounts Receivable Aging | Lagging | Invoicing Software | < 15% Over 30 Days | Highlights uncollected cash before overdue balances strain working capital. |
| Gross Profit Margin | Lagging | General Ledger | Industry Target (e.g., 35–50%) | Identifies rising production and materials costs eating into bottom-line profits. |
| Freight Cost per Unit | Leading | Freight Invoices / Logistics | Stable Week-over-Week | Catches transportation surcharge spikes before they distort monthly margins. |
| Quote-to-Close Velocity | Leading | CRM / Sales Pipeline | < 14 Days Turnaround | Predicts forward revenue pipeline health weeks in advance. |
| Order Cycle Time | Leading | Warehouse Management / ERP | Factory Target (e.g., < 48 hrs) | Surfaces shop-floor and fulfillment delays before customers escalate complaints. |
Focusing on leading metrics—such as freight rate variations and job cycle times—allows you to spot anomalies before they damage your net operating margins.
How a KPI Dashboard Small Business Hickory Implementation Uncovers Operational Bottlenecks
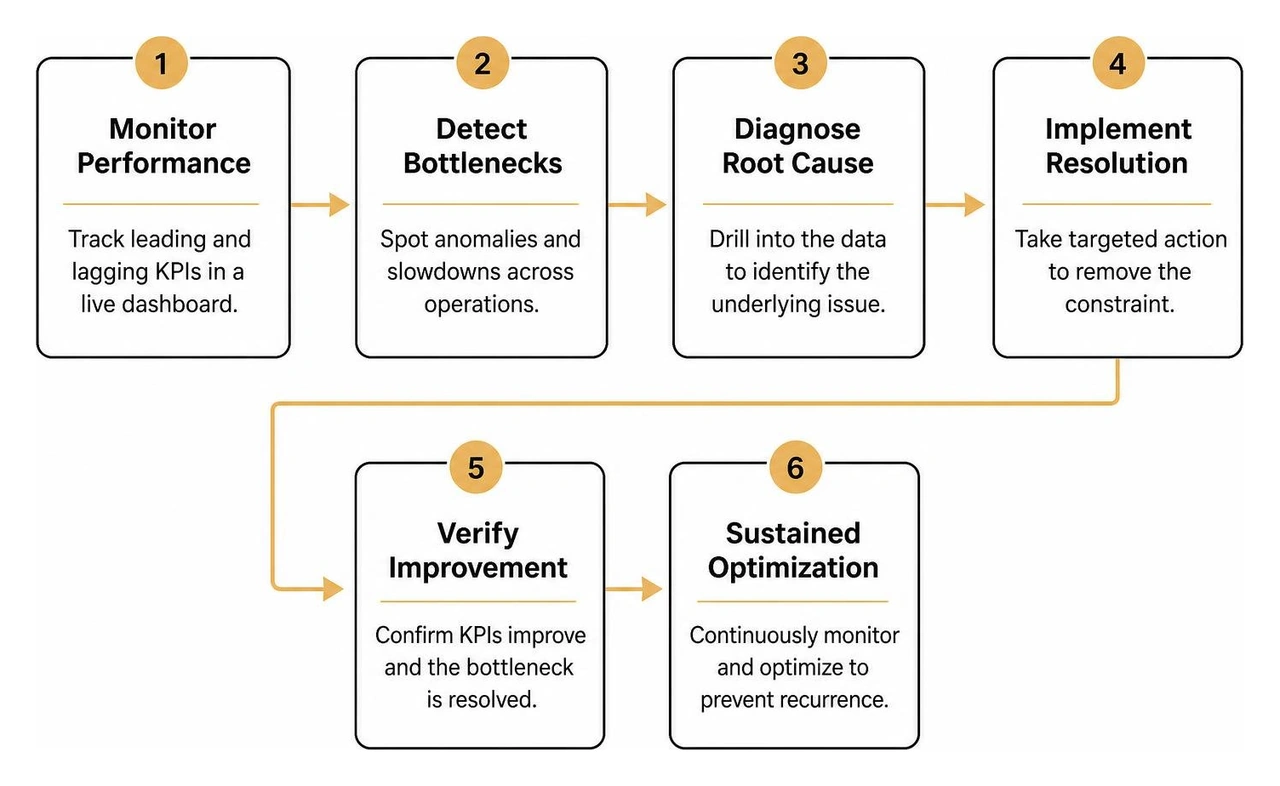
Operational friction rarely shows up on a standard balance sheet until thousands of dollars have already been lost. A production or logistics backlog in a Hickory facility might stem from a single misconfigured machine, an uninspected inventory variance, or slow customer sign-offs.

When shop-floor throughput, inventory levels, and accounts payable are visualized in a single live reporting view, hidden bottlenecks surface immediately. Implementing structured financial process optimization alongside these operational dashboards allows you to diagnose root causes—whether that means renegotiating terms with a supplier or rebalancing staffing during peak hours.
Step-by-Step Guide to Building a Live Small Business Dashboard
Building an automated KPI dashboard does not require enterprise-scale budgets or months of software engineering. Utilizing flexible tools like Google Looker Studio, you can assemble real-time reports that pull clean records directly from your transactional software. A structured kpi dashboard setup ensures your business transitions from manual spreadsheet entry to an automated reporting pipeline.
Setting Up a Core KPI Dashboard Small Business Hickory Framework
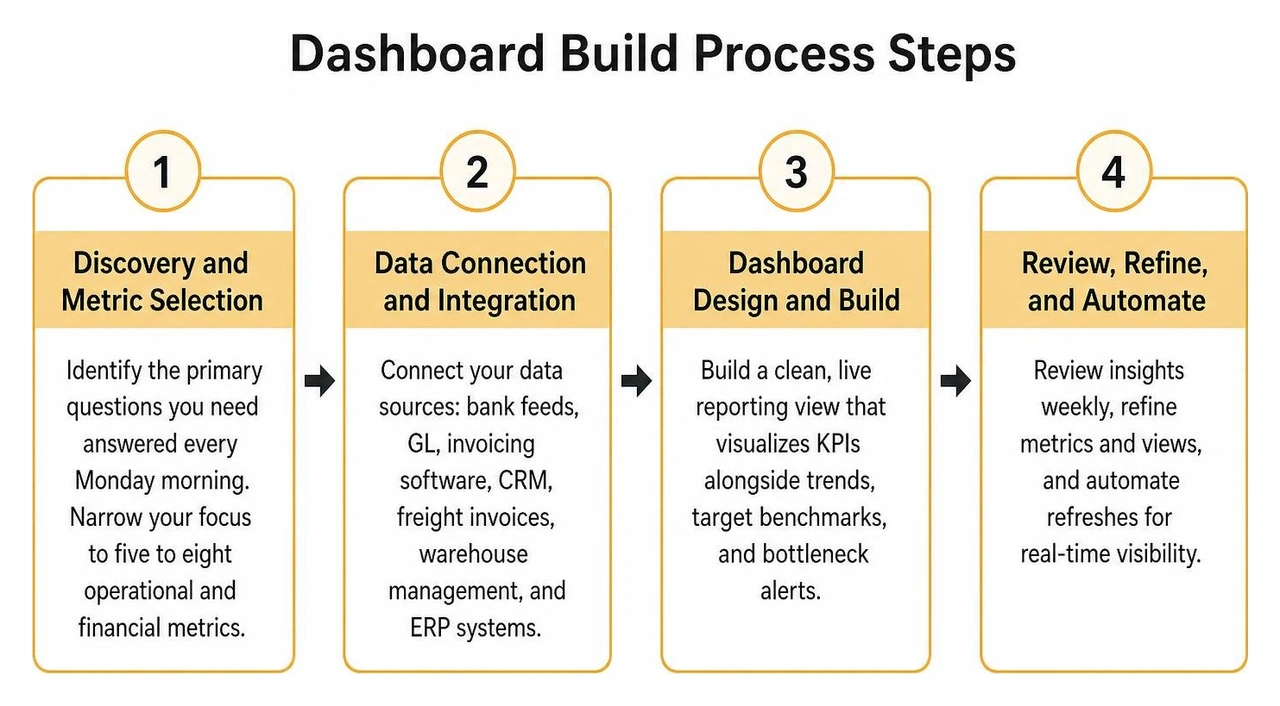
To create an actionable dashboard, follow a standardized four-phase framework:
- Discovery and Metric Selection: Identify the primary questions you need answered every Monday morning. Narrow your focus to five to eight operational and financial metrics.
- Data Pipeline Architecture: Connect your accounting software, point-of-sale platform, CRM, and inventory databases to a centralized visualization tool.
- Dashboard UX Design: Lay out metrics logically with high-level summaries at the top, supported by granular trend lines and exception alerts below.
- Team Review and Calibration: Launch the report, run it in tandem with existing reviews for two weeks, and train key personnel on how to track kpis consistently.
Tailored implementations—such as custom Looker Studio Dashboards for Hickory Businesses | DashboardDr—demonstrate how unified dashboards let managers track production, inventory, and quality metrics in one place.
From Messy Raw Data to Actionable Weekly Reporting
The biggest roadblock to reliable dashboards is dirty data: mismatched item numbers, unmapped general ledger accounts, duplicate customer profiles, and unlinked bank feeds.
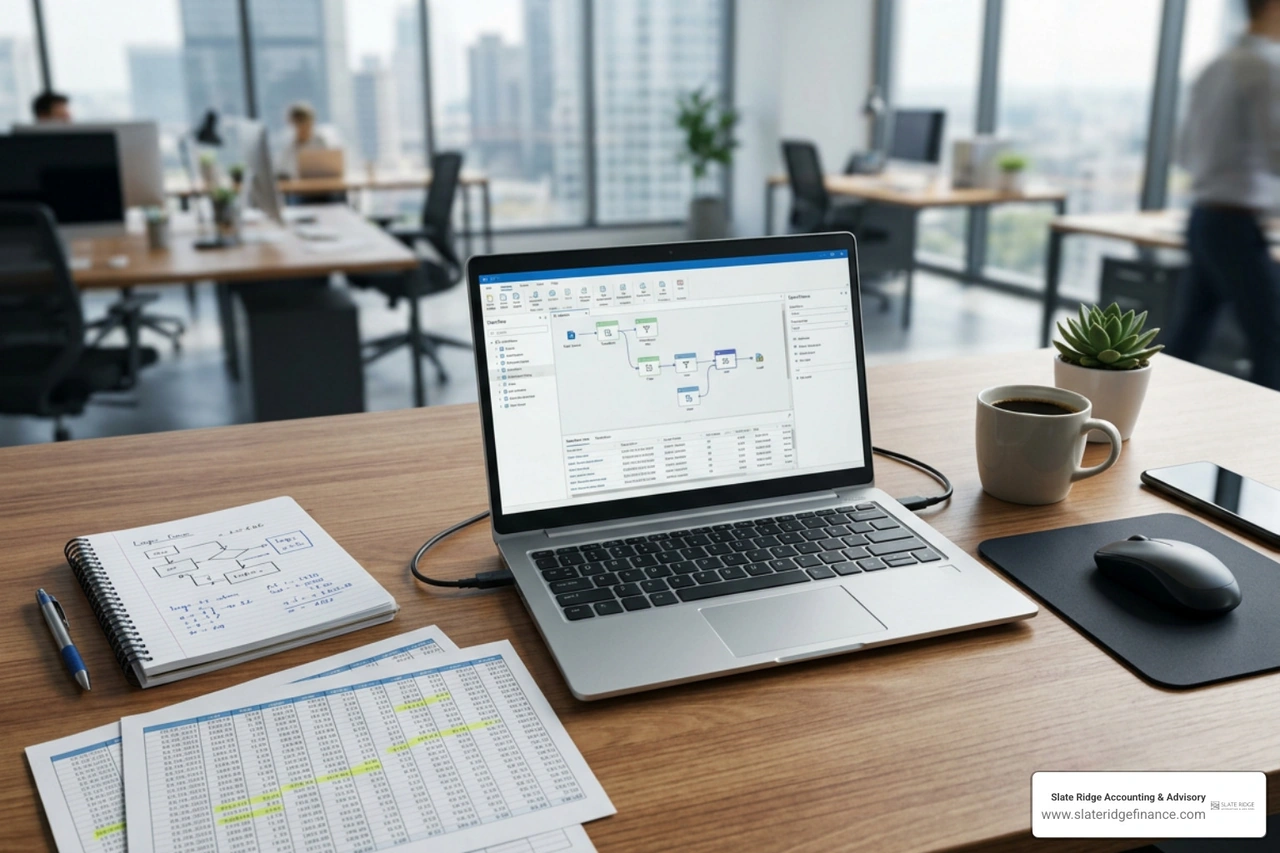
Before streaming raw records into your dashboard, establish strict normalization rules. First, complete a thorough workflow to clean up quickbooks so chart of accounts mappings remain uniform. When categorizations are consistent, your dashboard formulas produce dependable figures rather than misleading calculations.
Integrating Your Dashboard with the Local Hickory Tech Ecosystem
A modern business dashboard does not operate in a vacuum. It sits at the intersection of your physical infrastructure, communications platforms, and financial software. Connecting your reporting tools to the broader local technology ecosystem helps protect data reliability and streamline daily operations.
Aligning IT Infrastructure and Communication Systems
Real-time automated reports require dependable internet connectivity and resilient internal hardware. Incorporating scalable Business VoIP, Texting & AI Receptionist in NC alongside managed network support keeps your operational data flowing without interruption.
Proactive IT monitoring ensures servers, local endpoints, and connected sensors continuously feed operational metrics into your analytics tools. Pairing secure network architecture with modern financial management protects sensitive financial data while delivering fast dashboard load times for executive reviews.
Scaling Your Reporting Architecture as Your Company Grows
As your business opens new locations across North Carolina or adds distinct product divisions, your reporting structure must scale alongside it. A setup configured for a single facility will require updates as operational complexity increases.
- Maintain strict data governance by managing role-based user permissions across departments.
- Standardize chart-of-accounts mapping across multiple legal entities or sub-brands.
- Schedule quarterly metric calibration reviews to retire obsolete KPIs and introduce new growth targets.
- Revisit your accounting systems small business guide periodically to confirm your core software handles higher transaction volumes without lagging.
Integrating systematic dashboard reviews into your broader business growth strategies gives your leadership team the continuous visibility needed to make confident capital investments.
Frequently Asked Questions About Small Business Dashboards
How much does it cost to build a custom small business KPI dashboard?
Setup costs vary depending on the complexity of your data architecture. Simple single-source reporting systems generally start around $500, while multi-source platforms connecting ERPs, custom inventory databases, and financial software range between $2,000 and $5,000+. When planning your budget, reference our small business accounting costs guide to evaluate software subscription fees and ongoing advisory maintenance against expected operational savings.
What data sources should Hickory manufacturing and logistics firms connect first?
Regional manufacturing and distribution businesses should prioritize connecting their core accounting platform (such as QuickBooks Online or Xero), their Enterprise Resource Planning (ERP) or shop-floor scheduling software, and their freight invoicing systems. Establishing automated business performance tracking across these three sources ensures leadership can view gross margin yields, scrap rates, and logistics costs in a unified executive report.
How often should a small business owner review their KPI dashboard?
We recommend a weekly operating cadence. Reviewing leading indicators—such as pending orders, accounts receivable aging, and open production bottlenecks—every Monday morning gives you time to address issues before Friday. Detailed financial statements can then be reviewed monthly alongside forward-looking small business forecasting models to align operational output with long-term profitability goals.
Conclusion
A well-architected KPI dashboard removes the guesswork from managing your business. By uniting live accounting data, operational milestones, and early-warning indicators into a clear weekly report, you free yourself from operational logjams and build a more resilient company.
At Slate Ridge Accounting & Advisory, we help business owners modernize their back office with virtual bookkeeping, data clean-up, and real-time performance tracking. If you are ready to gain full visibility into your cash flow and operating numbers, explore our tailored virtual accounting solutions today.
Ready to get started?
Book a free consultation today and let’s explore how Slate Ridge can support your business with expert accounting that’s accurate, timely, and built around your goals.
You Might Also Like
A few more posts we think you’ll enjoy on topics that matter to business owners like you.